Lantronix Reports Third Quarter Fiscal 2012 Financial Results
–Company Reduces GAAP Net Loss to $41,000 and Achieves Non-GAAP Net Income of $471,000 for the Quarter–
Irvine, Calif., May 3, 2012 – Lantronix, Inc. (the “company”) (NASDAQ: LTRX), a leading global provider of smart M2M connectivity solutions, today reported results for its third quarter of fiscal 2012, ended March 31, 2012.
Financial and Operational Highlights
- Net revenue of $12.1 million.
- Gross profit as a percentage of net revenue was 48.8%.
- GAAP net loss of $(41,000), or ($0.00) per share.
- Non-GAAP net income of $471,000, or $0.04 per share.
- Net inventories of $6.8 million, a reduction of 20% from the prior fiscal quarter.
- In January 2012, the company began shipping the its award-winning xPrintServer™ – Network Edition, the first network solution to allow iPad and Apple mobile iOS users to print wirelessly to virtually any networked printer.
- In February 2012, the company introduced and began sampling two new device enablement products, PremierWave-XN™, a next generation dual band multi port serial device server, and xPico™, the world’s smallest embedded device server measuring less than 4 cm2.
- In April 2012, the company completed a private placement and in May 2012 the company completed an underwritten public offering which collectively generated net proceeds of approximately $9.3 million from the sale of common shares.
Public Offering and Private Placement
On April 25, 2012, the company completed a private placement with TL Investment GmbH, its largest shareholder (“TL Investment”), pursuant to which it sold to TL Investment 1.6 million shares of the company’s common stock for $2.8025 per share for net proceeds of approximately $4.4 million. The common stock was priced above the Nasdaq closing bid price and last sale price of $2.80 on April 24, 2012, the date of the Stock Purchase Agreement. TL Investment is beneficially owned by Bernhard Bruscha, a founder and director of the company. After taking into effect the public offering, described below, Mr. Bruscha’s/TL Investment’s ownership percentage of the company increased from approximately 40.4% to 40.8%. If the underwriter exercises its option to purchase an additional 330,000 common shares as described below, then Mr. Bruscha’s/TL Investment’s ownership percentage of the company will decrease to approximately 39.9%
On May 1, 2012, the company completed an underwritten public offering of 2.2 million shares of common stock at a price of $2.50 per share for net proceeds of approximately $4.9 million. In connection with the public offering, the company granted the underwriter a 30-day option to purchase up to 330,000 additional shares of our common stock at $2.50 per share.
Financial Results for the Third Quarter of Fiscal 2012, Ended March 31, 2012
“We are pleased with the significant progress we made during the quarter ended March 31, 2012, which included a sequential revenue increase of 16%, the third sequential quarter of margin improvement, non-GAAP profitability, a 20% reduction in our net inventory levels from the quarter ended December 31, 2011 and the production release of the xPrintServer – Network Edition, plus the announcement of two new device enablement products. The progress achieved in the third fiscal quarter of 2012 represents the initial results of the strategic plan that we began to implement during the second fiscal quarter of 2012,” said Lantronix CEO Kurt Busch.
“The management team’s focus during fiscal 2012 has been on strengthening the company’s financial metrics and establishing a strong foundation for future growth and profitability,” continued Lantronix CEO Kurt Busch. “The proceeds from the recently closed public offering and private placement will help to further our goal of strengthening Lantronix’ balance sheet and providing necessary working capital as we continue to execute on our strategy.”
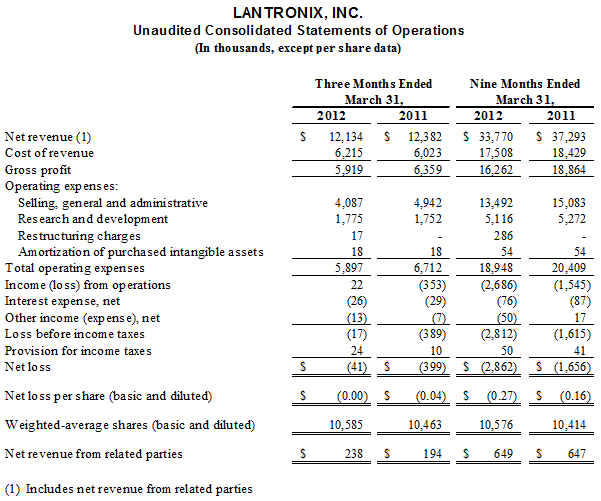
Net revenue was $12.1 million for the third quarter of fiscal 2012, a decrease of $248,000 or 2%, compared to $12.4 million for the third quarter of fiscal 2011 and an increase of $1.7 million or 16%, compared to $10.5 million for the second quarter of fiscal 2012. The year-over-year decrease in net revenue was primarily due to decreases in our external device enablement and device management product lines. The sequential increase in net revenue was primarily due to (i) a $1.1 million increase in our device enablement product line as a result of a recovery in embedded sales in our EMEA and Americas regions and (ii) a $0.6 million increase in our device management product line primarily as a result of sales from the xPrintServer™- Network Edition that began taking pre-orders on December 13, 2011.
Gross profit as a percentage of net revenue (“gross margin”) was 48.8% for the third quarter of fiscal 2012, compared to 51.4% for the third quarter of fiscal 2011 and 48.2% for the second quarter of fiscal 2012. The year-over-year decrease in gross margin was primarily the result of expedited freight and manufacturing costs to meet higher than expected customer demand and lower absorption of manufacturing overhead costs as a result of a $1.7 million reduction of inventories.
GAAP operating expenses for the third quarter of fiscal 2012 were $5.9 million, a decrease of $0.8 million or 12%, compared to $6.7 million for the third quarter of fiscal 2011 and a decrease of $0.5 million or 7%, compared to $6.4 million for the second quarter of fiscal 2012.
- Selling, general and administrative expenses were $4.1 million for the third quarter of fiscal 2012, a decrease of $0.9 million or 17%, compared to $4.9 million for the third quarter of fiscal 2011 and a decrease of $0.4 million or 8%, compared to $4.4 million for the second quarter of fiscal 2012.
- Research and development expenses were $1.8 million for the third quarter of fiscal 2012, compared to $1.8 million for the third quarter of fiscal 2011 and an increase of $0.1 million or 8%, compared to $1.6 million for the second quarter of fiscal 2012.
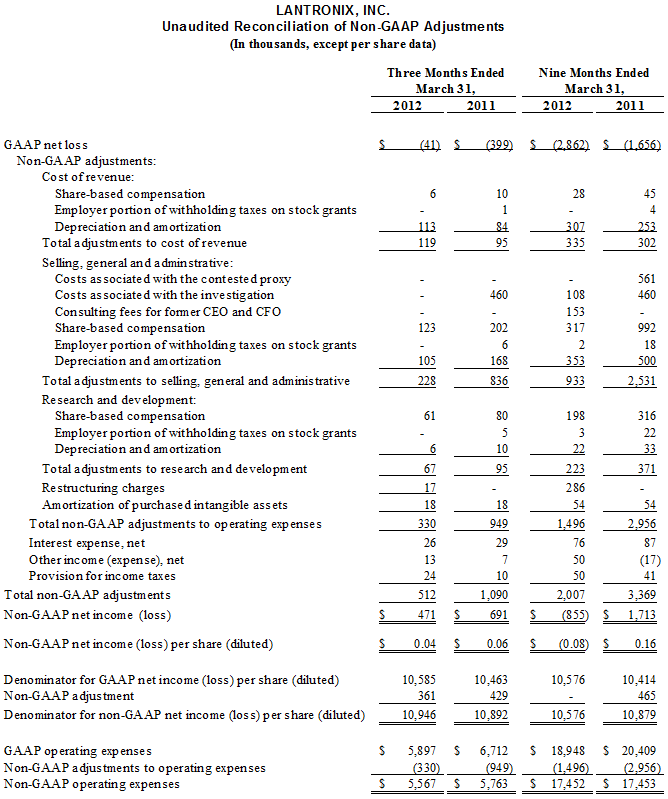
Non-GAAP operating expenses for the third quarter of fiscal 2012 were $5.6 million, a decrease of 3%, compared with $5.8 million for the third quarter of fiscal 2011 and a decrease of 4%, compared to $5.8 million for the second quarter of fiscal 2012.
GAAP net loss for the third quarter of fiscal 2012 was $(41,000), or ($0.00) per share, compared to a GAAP net loss of $(399,000), or ($0.04) per share, for the third quarter of fiscal 2011 and a GAAP net loss of $(1.4 million), or ($0.13) per share, for the second quarter of fiscal 2012.
Non-GAAP net income for the third quarter of fiscal 2012 was $471,000, or $0.04 per share compared to non-GAAP net income of $691,000, or $0.06 per share for the third quarter of fiscal 2011 and a non-GAAP net loss of $(629,000), or ($0.06) per share, for the second quarter of fiscal 2012.
Financial Results for the Nine Months ended March 31, 2012
Net revenue was $33.8 million for the nine months ended March 31, 2012, compared to $37.3 million for the nine months ended March 31, 2011.
Gross profit as a percentage of net revenue was 48.2% for the nine months ended March 31, 2012, compared with 50.6% for the nine months ended March 31, 2011.
GAAP operating expenses for the nine months ended March 31, 2012 were $18.9 million, compared to $20.4 million for the nine months ended March 31, 2011.
- Selling, general and administrative expenses for the nine months ended March 31, 2012 were $13.5 million, compared to $15.1 million for the nine months ended March 31, 2011.
- Research and development expenses for the nine months ended March 31, 2012 were $5.1 million, compared to $5.3 million for the nine months ended March 31, 2011.
- Restructuring charges for the nine months ended March 31, 2012 were $286,000.
Non-GAAP operating expenses for the nine months ended March 31, 2012 were $17.5 million, compared to $17.5 million for the nine months ended March 31, 2011.
GAAP net loss for the nine months ended March 31, 2012 was $(2.9) million, or ($0.27) per share, compared to $(1.7) million, or ($0.16) per share, for the nine months ended March 31, 2011.
Non-GAAP net loss for the nine months ended March 31, 2012 was $(855,000) or ($0.08) per share, compared to non-GAAP net income of $1.7 million, or $0.16 per share, for the nine months ended March 31, 2011.
Balance Sheet Summary
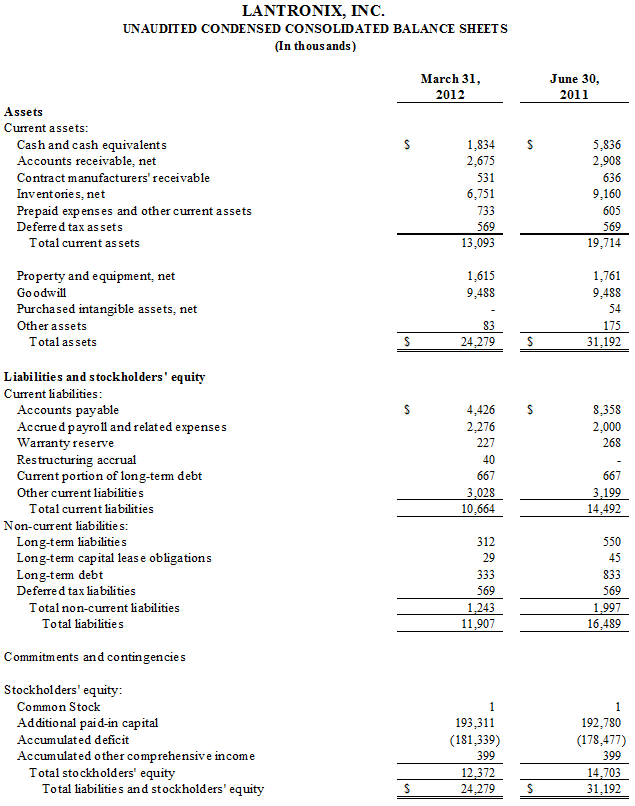
Cash and cash equivalents were $1.8 million as of March 31, 2012, compared to $5.8 million as of June 30, 2011.
Accounts receivable were $2.7 million as of March 31, 2012, compared to $2.9 million as of June 30, 2011.
Net inventories were $6.8 million as of March 31, 2012, compared to $9.2 million as of June 30, 2011.
Accounts payable were $4.4 million as of March 31, 2012, compared to $8.4 million as of June 30, 2011.
Working capital was $2.4 million as of March 31, 2012, compared to $5.2 million as of June 30, 2011.
In April and May of 2012, as referenced above, the company closed a private placement of shares of its common stock and closed an underwritten public offering of its shares of common stock. These two transactions generated aggregate net proceeds of approximately $9.3 million.
Discussion of Non-GAAP Financial Measures
Lantronix believes that the presentation of non-GAAP financial information, when presented in conjunction with the corresponding GAAP measures, provides important supplemental information to management and investors regarding financial and business trends relating to the Company’s financial condition and results of operations. The non-GAAP financial measures disclosed by the Company should not be considered a substitute for, or superior to, financial measures calculated in accordance with GAAP, and the financial results calculated in accordance with GAAP and reconciliations to those financial statements should be carefully evaluated. The non-GAAP financial measures used by the Company may be calculated differently from, and therefore may not be comparable to, similarly titled measures used by other companies. The Company has provided reconciliations of the non-GAAP financial measures to the most directly comparable GAAP financial measures. Management believes that non-GAAP operating expenses, non-GAAP net income (loss) and non-GAAP net income (loss) per share are important measures of the Company’s business. Management uses the aforementioned non-GAAP measures to monitor and evaluate ongoing operating results and trends and to gain an understanding of our comparative operating performance. In addition, certain stockholders have expressed an interest in seeing financial performance measures, which exclude the impact of certain matters such as decisions relating to the restructuring, which while important, are not central to the core operations of the Company’s business.
Non-GAAP operating expenses consist of operating expenses excluding share-based compensation and related payroll taxes, depreciation and amortization, restructuring charges, costs associated with the contested proxy, costs associated with the 2011 independent investigation of certain allegations by a director of Lantronix, and consulting fees for former named executive officers.
Non-GAAP net income (loss) consists of net income (loss) excluding (i) non-GAAP adjustments to operating expenses, (ii) interest income (expense), (iii) other income (expense), and (iv) income tax provision (benefit).
Non-GAAP net income (loss) per share is calculated by dividing non-GAAP net income (loss) by non-GAAP weighted-average shares outstanding (diluted). For purposes of calculating non-GAAP net income (loss) per share, the calculation of GAAP weighted-average shares outstanding (diluted) is adjusted to exclude share-based compensation, which for GAAP purposes is treated as proceeds assumed to be used to repurchase shares under the GAAP treasury stock method.
Conference Call and Webcast
Lantronix will host a conference call and webcast today at 2:00 p.m. Pacific Time (5:00 p.m. ET) to discuss its third quarter fiscal 2012 financial results. Those wishing to participate in the live call should dial 800-510-0178 (international dial-in 617-614-3450) using the passcode 76153560. A telephone replay of the call will be available through May 17, 2012 by dialing (888) 286-8010 (international dial-in 617-801-6888) and entering passcode 11466881.
About Lantronix
Lantronix, Inc. (NASDAQ: LTRX) is a global leader of secure communication technologies that simplify access and communication with and between virtually any electronic device. Our smart connectivity solutions enable sharing data between devices and applications to empower businesses to make better decisions based on real-time information, and gain a competitive advantage by generating new revenue streams, improving productivity and increasing efficiency and profitability. Easy to integrate and deploy, Lantronix products remotely and securely connect electronic equipment via networks and the Internet. Founded in 1989, Lantronix serves some of the largest medical, security, industrial and building automation, transportation, retail/POS, financial, government, consumer electronics/appliances, IT/data center and pro-AV/signage entities in the world. The company’s headquarters are located in Irvine, Calif.
For more information, visit www.lantronix.com. The Lantronix blog, https://www.lantronix.com/blog, features industry discussion and updates.
Forward-Looking Statements
This news release contains forward-looking statements, including statements concerning our future business plans, future financial position, future results of operations and future product development strategies and schedules. These forward-looking statements are based on current management expectations and are subject to risks and uncertainties that could cause actual reported results and outcomes to differ materially from those expressed in the forward-looking statements. Factors that could cause our expectations and reported results to vary, include, but are not limited to: our ability to raise additional capital when and to the extent necessary; final accounting adjustments and results; quarterly fluctuations in operating results; our ability to identify and profitably develop new products that will be attractive to our target markets, including products in our device networking business and the timing and success of new product introductions; our ability to implement the planned cost reduction program; changing market conditions and competitive landscape; government and industry standards; market acceptance of our products by our customers; pricing trends; actions by competitors; future revenues and margins; changes in the cost or availability of critical components; unusual or unexpected expenses; and cash usage including cash used for product development or strategic transactions; and other factors that may affect financial performance. For a more detailed discussion of these and other risks and uncertainties, see our SEC filings, including our Annual Report on Form 10-K for the year ended June 30, 2011 and our Quarterly Reports on Form 10-Q for the quarters ended September 30, 2011, December 31, 2011, March 31, 2012, and our Annual Report on Form 10-K for the year ended June 30, 2011. Readers are cautioned not to place undue reliance on these forward-looking statements, which speak only as of the date hereof, and the Company undertakes no obligation to update these forward-looking statements to reflect subsequent events or circumstances. If the Company does update or correct one or more of these forward-looking statements, investors and others should not conclude that the Company will make additional updates or corrections.
# # #
Investor Relations Contacts:
Lantronix, Inc.
Jeremy Whitaker
Chief Financial Officer
(949) 453-3990
E.E. Wang Lukowski
[email protected]
310-877-6039

